Example: Check Atom Balance
This example explains the Atom Balance calculation features. Please import the AtomBalance_Example.rex from Optience Corporation\REX Suite\REX Examples folder. If you upgraded from a previous version of REX, you may find the examples folder one level above in the Optience Corporation\REX Examples folder located in your installation directory.
Atom Balance in Reactions
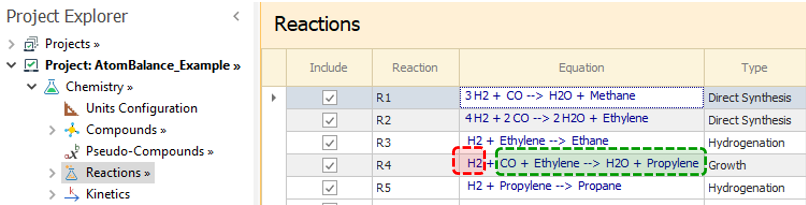
You may check for mistakes in the reactions. In the imported example, there is an error in the definition of the R4 reaction.
REX can alert you to these errors as long as the atom content for the compounds is entered in the Formula node, as shown below.
Note: It is not necessary to fill Molecular Weights for any of the atom balance checks.
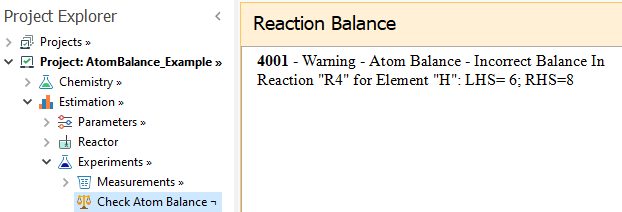
When you select the Check Atom Balance node, a warning is shown:
The message above informs you about the imbalance in Hydrogen for reaction R4. There are only 6 atoms of Hydrogen in the Left Hand Side (LHS) of that reaction, but 8 on the Right Hand Side (RHS).
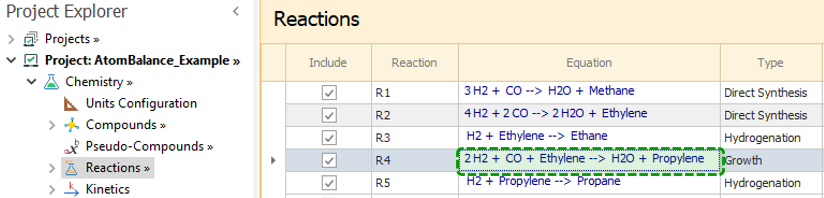
If the stoichiometry is corrected for reaction R4, the warning message disappears.
R4 : 2H2 + CO + Ethylene → Propylene + H2O
Top of Topic
|
|---|
REX can alert you to these errors as long as the atom content for the compounds is entered in the Formula node, as shown below.

|
|---|
When you select the Check Atom Balance node, a warning is shown:
|
|---|
The message above informs you about the imbalance in Hydrogen for reaction R4. There are only 6 atoms of Hydrogen in the Left Hand Side (LHS) of that reaction, but 8 on the Right Hand Side (RHS).
If the stoichiometry is corrected for reaction R4, the warning message disappears.
R4 : 2H2 + CO + Ethylene → Propylene + H2O
|
|---|
Atom Balance in Experimental Data
You may also check the atom balance in the experimental data, to quantify the error for each element in each set.
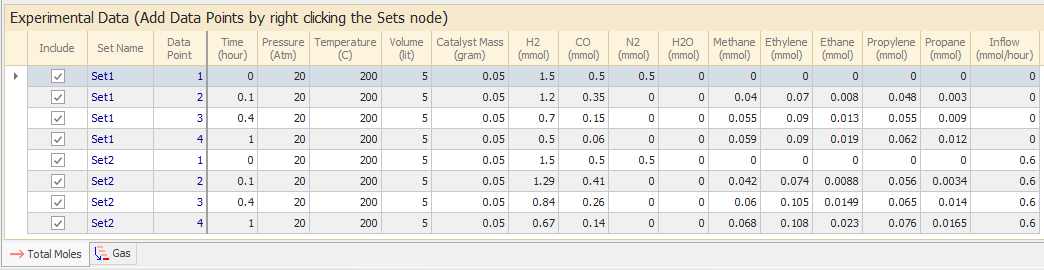
In the example, a Batch reactor with a constant Inflow of CO + H2 with a 50:50 molar composition is considered.
In the Experiments node, two experimental sets are defined, and the data for them is shown below:
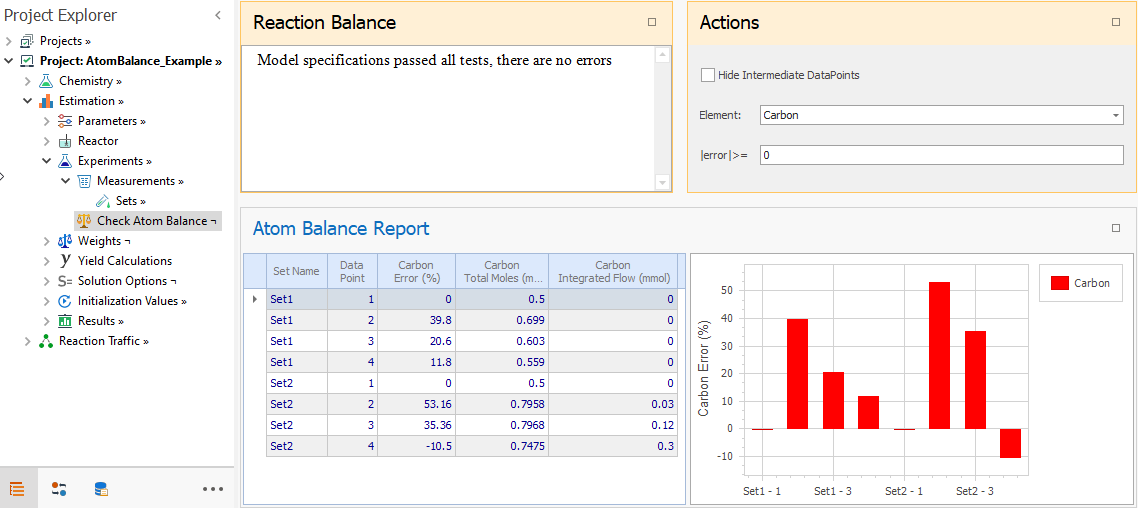
If you choose not to hide intermediate datapoints and show all non-zero errors, you will obtain the following results:
You can see that the values in the Carbon Total Moles column is 0.5 mmol at the first datapoint for both sets. This is consistent with the experimental data: both sets have an initial charge of 0.5 mmol of CO and no other compound with carbon. The Carbon Total Moles values for subsequent datapoints is just the carbon content in the experimental data at those datapoints.
In the case of a Multiphase reactor, the same calculation is done. For both Single or Multiphase, the calculations are always done based on the experimental data loaded in the Total Moles tab, while the phase composition data are not considered (except for integration of multiphase batch outflows streams of reaction mixture composition).
As for the Carbon Integrated Flow column, it only adds the carbon that enters/leaves the reactor due to Inflows/Outflows.
In this example, only Inflow is considered. Since the inflows are zero in Set1, the integrated carbon for Set1 is also zero.
For Set 2, the Inflow has a constant value of 0.6mmol/h and contains 50% CO. Integrating it from the first to the second datapoint ( i.e.: from time zero to 0.1h), you get the value of (0.1h) * (0.6mmol/h) * (0.5) = 0.03mmol. That value is shown for datapoint 2 in the Carbon Integrated column. As for the value reported in the third datapoint, it represents the integration from datapoint 1 to 3 ( or equivalently, from time 0h to 0.4h).
Let's take a look at the reported values for the Carbon Error column.
For Set1 and datapoint 2, Carbon Total Moles is 0.699mmol. Considering that Inflow is zero in this set, that value implies that there is an excess of 39.8% carbon in the second datapoint with respect to the first datapoint.
For Set2, in datapoint 3 the integrated Carbon through the inflow is 0.12mmol. If carbon error were zero (no error in data), Carbon Total Moles at Datapoint 3 should have been (0.50mmol) + (0.12mmol) = 0.62mmol. The reported value of 0.7968mmol implies a carbon excess of (0.7968mmol) - (0.62mmol) = 0.1768mmol for datapoint 3. This figure represent a 35.36% excess with respect to the carbon content on the first datapoint.
The Percentage Errors are graphically displayed in the Chart.
You may see the set and datapoint corresponding to this row by moving the mouse over the error bar in the chart.
In the example, a Batch reactor with a constant Inflow of CO + H2 with a 50:50 molar composition is considered.
In the Experiments node, two experimental sets are defined, and the data for them is shown below:
|
|---|
If you choose not to hide intermediate datapoints and show all non-zero errors, you will obtain the following results:
|
|---|
You can see that the values in the Carbon Total Moles column is 0.5 mmol at the first datapoint for both sets. This is consistent with the experimental data: both sets have an initial charge of 0.5 mmol of CO and no other compound with carbon. The Carbon Total Moles values for subsequent datapoints is just the carbon content in the experimental data at those datapoints.
In the case of a Multiphase reactor, the same calculation is done. For both Single or Multiphase, the calculations are always done based on the experimental data loaded in the Total Moles tab, while the phase composition data are not considered (except for integration of multiphase batch outflows streams of reaction mixture composition).
As for the Carbon Integrated Flow column, it only adds the carbon that enters/leaves the reactor due to Inflows/Outflows.
In this example, only Inflow is considered. Since the inflows are zero in Set1, the integrated carbon for Set1 is also zero.
For Set 2, the Inflow has a constant value of 0.6mmol/h and contains 50% CO. Integrating it from the first to the second datapoint ( i.e.: from time zero to 0.1h), you get the value of (0.1h) * (0.6mmol/h) * (0.5) = 0.03mmol. That value is shown for datapoint 2 in the Carbon Integrated column. As for the value reported in the third datapoint, it represents the integration from datapoint 1 to 3 ( or equivalently, from time 0h to 0.4h).
Let's take a look at the reported values for the Carbon Error column.
For Set1 and datapoint 2, Carbon Total Moles is 0.699mmol. Considering that Inflow is zero in this set, that value implies that there is an excess of 39.8% carbon in the second datapoint with respect to the first datapoint.
For Set2, in datapoint 3 the integrated Carbon through the inflow is 0.12mmol. If carbon error were zero (no error in data), Carbon Total Moles at Datapoint 3 should have been (0.50mmol) + (0.12mmol) = 0.62mmol. The reported value of 0.7968mmol implies a carbon excess of (0.7968mmol) - (0.62mmol) = 0.1768mmol for datapoint 3. This figure represent a 35.36% excess with respect to the carbon content on the first datapoint.
The Percentage Errors are graphically displayed in the Chart.
You may see the set and datapoint corresponding to this row by moving the mouse over the error bar in the chart.
Top of Topic
Go back to: